Utilization rate: Formula, benchmarks & how to improve

Summary
When you work with clients, tracking how your team spends their time is essential for staying profitable. Utilization rate tells you how much of your team's available time is spent on billable work, helping you spot inefficiencies, balance workloads, and make smarter decisions about staffing and pricing. In this article, you'll learn what utilization rate is, how to calculate it, what a good rate looks like across industries, and how to improve it with real-world examples and the right tools.
Optimizing your tech stack for the AI era
From security risks to productivity loss, app sprawl may be costing you more than you think. Our latest guide reveals the true impact of an oversized tech stack and provides strategies to optimize your IT spend. Don't let hidden costs hold you back:
What is utilization rate?
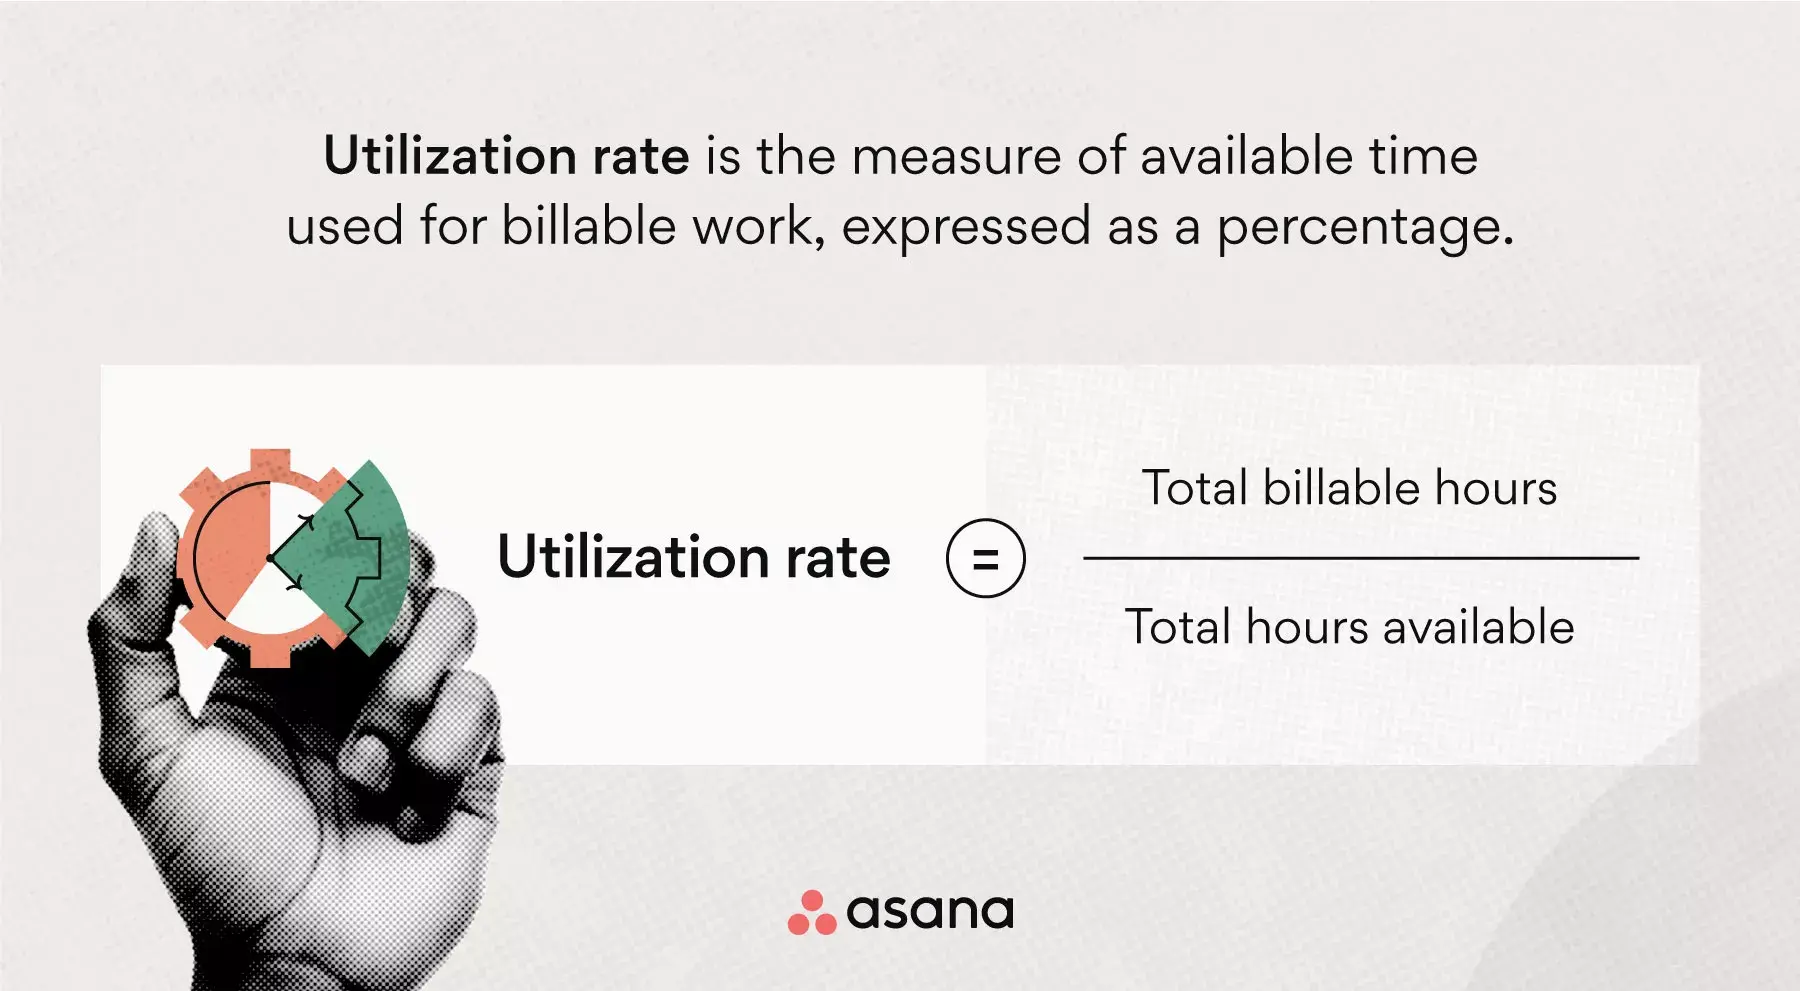
Utilization rate is the percentage of an employee's total available working hours spent on billable, client-facing work. You calculate it by dividing total billable hours by total available hours, then multiplying by 100.
For example, if a team member bills 34 hours in a 40-hour workweek, their utilization rate is 85% (34 ÷ 40 = 0.85 × 100).
Importance of tracking utilization rate
Keep in mind that a team member's utilization rate will never reach 100% because they must dedicate some time to internal work. There should be a healthy balance in a team member's workweek between team meetings, phone calls, training, and billable work.
So the goal of calculating and tracking utilization rate isn't to get to 100%, it's to reduce the unnecessary manual and duplicative work that takes up so much of our workday. According to the Anatomy of Work Index, the average knowledge worker spends 60% of their time on busywork, things like searching for information, chasing approvals, and switching between apps. By reducing this unnecessary busywork, you can increase utilization rates across your team and make more time for your team members to focus on their high-impact tasks.
![[Product UI] Adjust your team's workload as needed (Workload)](https://assets.asana.biz/transform/04f7d02f-1ce7-48dc-91d4-d17f2d3b3f9e/inline-generic-workload-2x?io=transform:fill,width:2560&format=webp)
Billable utilization vs. resource utilization
When people talk about utilization rate, they're usually referring to billable utilization. But there's a broader metric worth knowing: resource utilization. Here's how they compare:
Billable utilization | Resource utilization | |
What it measures | Hours billed directly to clients | All productive hours, including internal work |
Includes non-billable work | No | Yes (training, admin, internal projects) |
Best for | Tracking revenue-generating time | Understanding total team productivity |
Tracking both metrics side by side helps you make more informed decisions about workload distribution and hiring. Focusing only on billable utilization can make it appear that a team member isn't contributing, even though they may be spending significant time on essential internal work.
How to calculate utilization rate
Tracking team member utilization rate informs your company's overall profitability. The formula for one team member's utilization rate is simple enough, but you'll need a handful of formulas to calculate your company's ideal numbers.
1. Utilization rate formula
To calculate team member utilization rate, use the basic utilization rate formula:
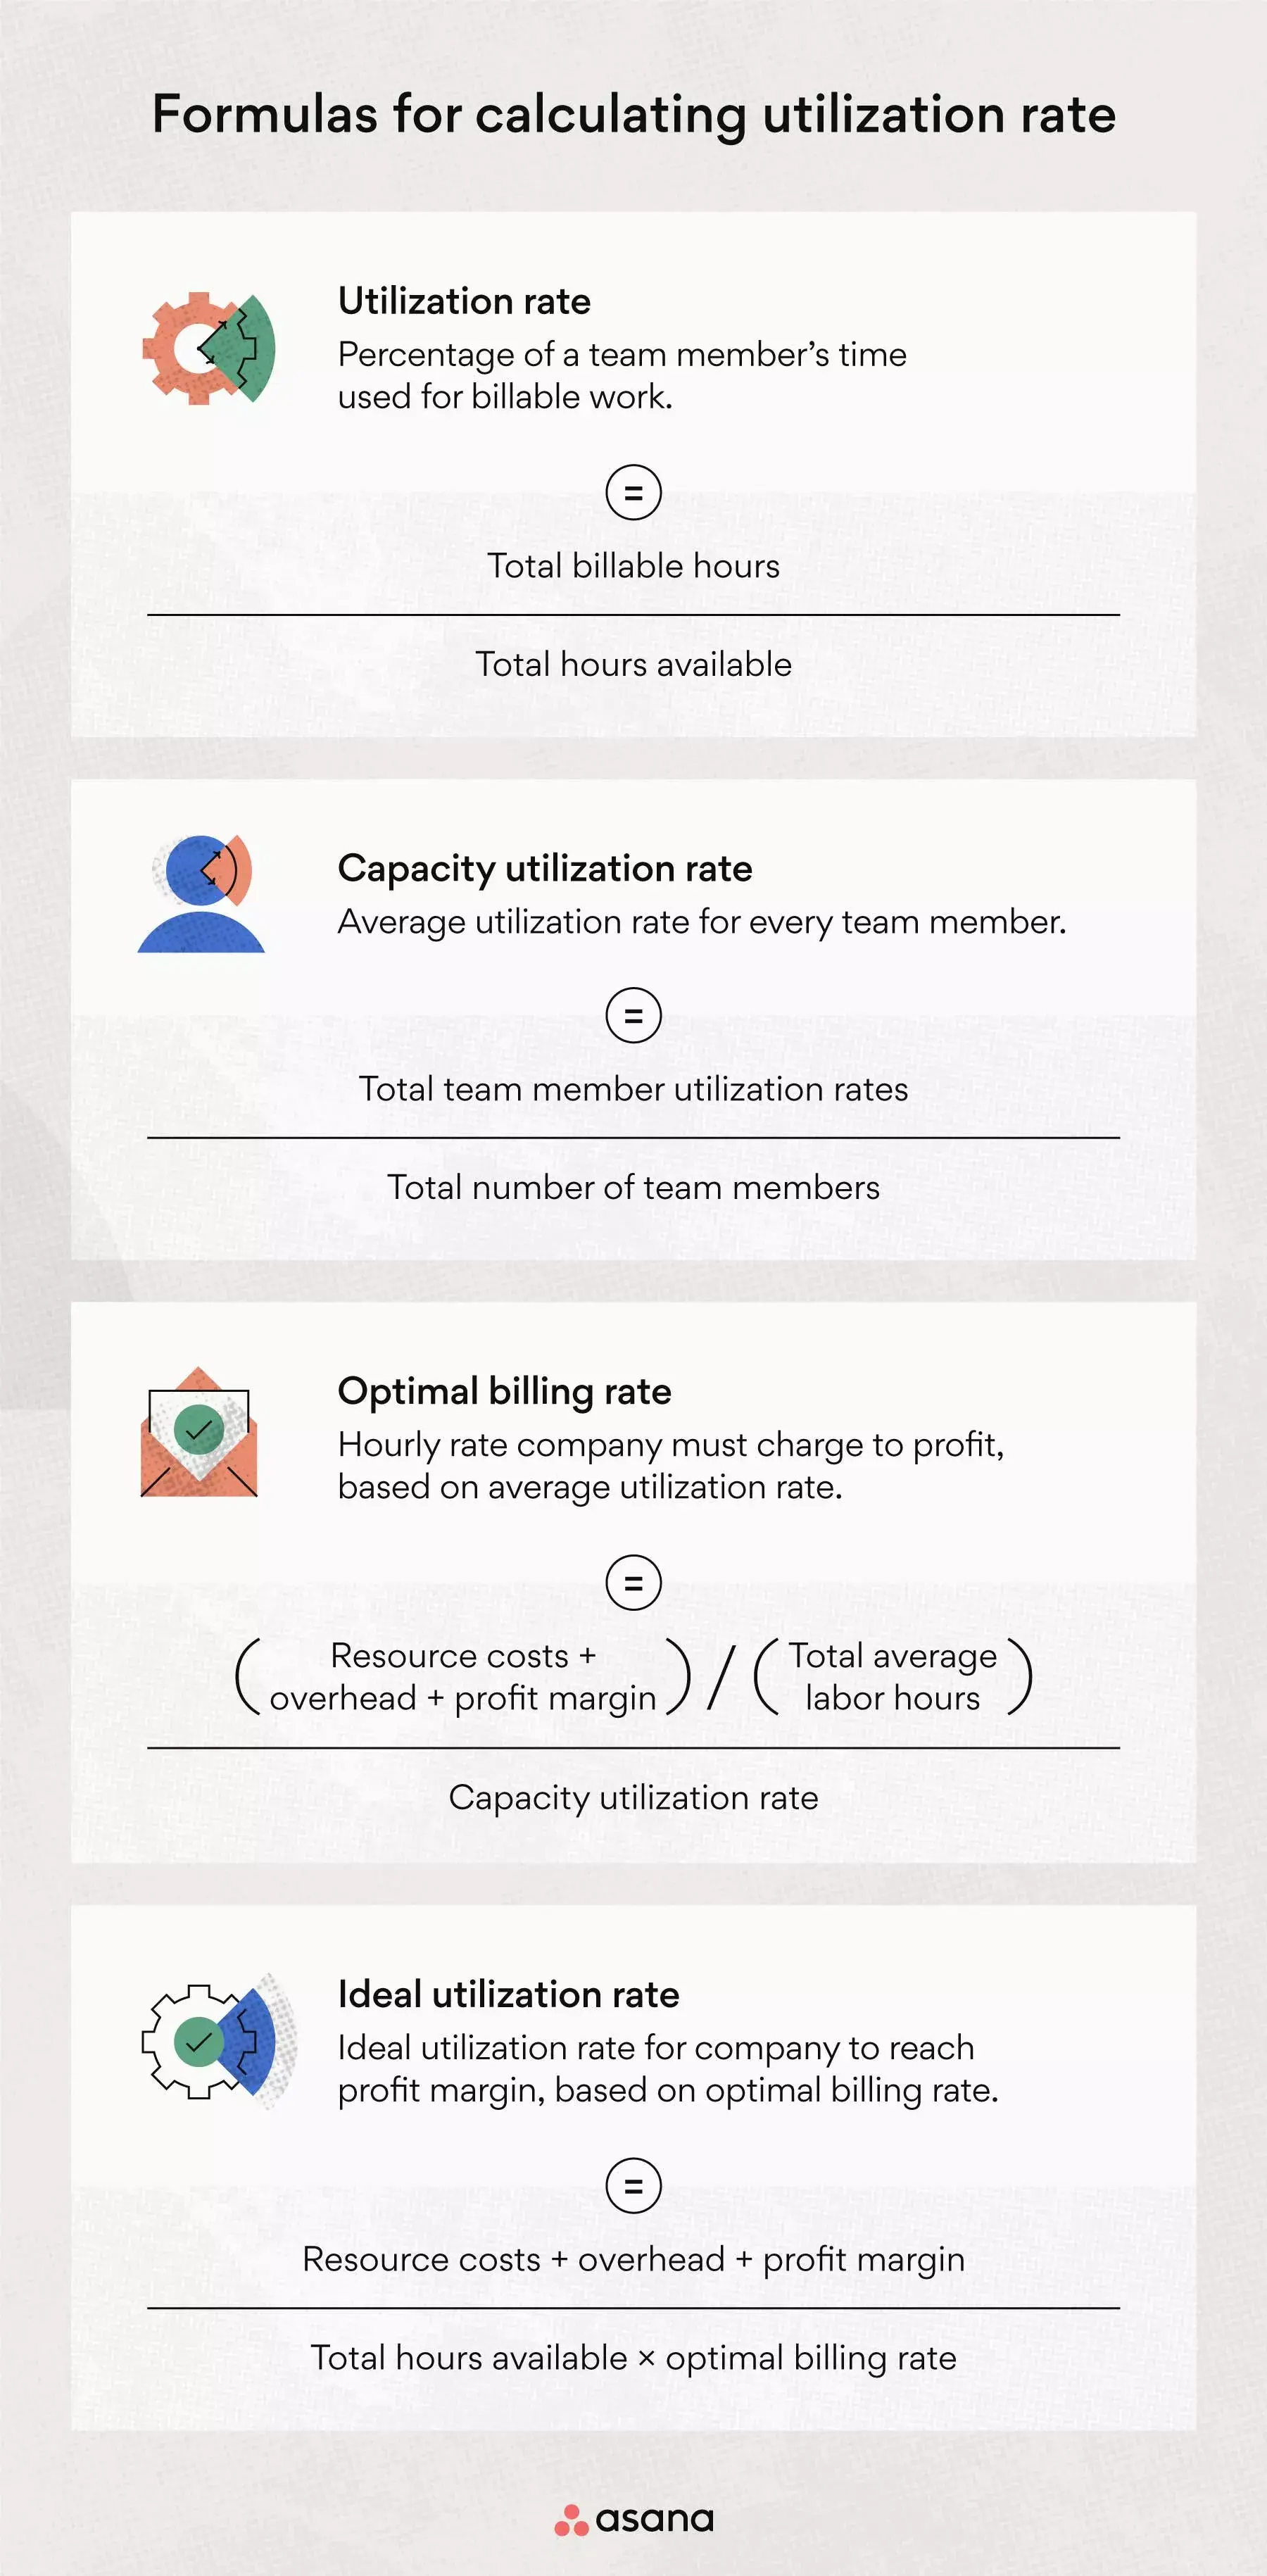
Utilization rate formula: (Total billable hours / total hours available)
For example, if a team member billed for 32 hours from a 40-hour week, their utilization rate would be 0.80, or 80%.
Team member utilization rates differ based on job role and productivity, so calculating an individual team member's utilization rate isn't enough. Instead, make sure you're tracking utilization rates for all team members in order to get a more accurate picture of company performance.
How reducing busywork increases your team's utilization rate
If your team's utilization rate is low, review your company's tools, processes, and expectations. Common causes of busywork that cut into billable time include:
App switching: The average knowledge worker switches between 10 and 25 apps per day.
Manual, repetitive tasks: Data entry, status updates, and formatting work that could be automated.
Searching for information: Time lost tracking down files, approvals, or project details across disconnected tools.
If app switching is a major issue for your team, look for business tools that connect with one another so team members have everything they need in one place.
Tip: Time tracking software can keep team member metrics organized and make it easier to perform calculations. It can also ensure your calculations are accurate and make any mistakes easier to spot and correct.
2. Capacity utilization rate
The capacity utilization rate is the average utilization per team member. This is the formula that tells you whether you can cover your resource costs and make a profit.
Capacity utilization rate = Total team member utilization rates / Total number of team members
To calculate your company's capacity utilization rate, add the utilization rates of every team member and divide this number by the total number of team members.
3. Optimal billing rate
Once you calculate your team's capacity utilization rate, use that number to determine how much you should charge clients to achieve a profit, also known as your optimal billing rate.
To use this formula, you'll need three numbers:
Resource costs: The amount you spend on labor, direct materials, or production.
Overhead: Your indirect costs, listed on a per team member basis.
Profit margin: The percentage of profit you hope to achieve above business costs, expressed as a dollar amount for this formula.
While profit margin is typically expressed as a percentage, you'll need to use your resources and overhead costs to turn your profit margin into a dollar amount for this formula.
Profit margin as dollar amount = (Resource costs + overhead) x Profit margin as a percentage
Optimal billing rate = (Resource costs + overhead + profit margin) / Total average labor hours / Capacity utilization rate
So, for example, if your labor costs are $50,000, you spend $10,000 in overhead per employee, your optimal profit margin is 25% (($50,000 + $10,000) x .25 = $15,000), and your total average labor hours is 1,000, then the top number in this formula would be 75. If your capacity utilization rate is .80, then your optimal billing rate would be $94 per hour.
Optimal billing rate = [($50,000 + $10,000 + $15,000) / (1,000)] / .80
4. Ideal utilization rate
Your capacity utilization rate shows the average number of hours your team members bill relative to the total hours they work, but it won't tell you whether that rate is the ideal level given company costs. The best way to understand the ideal utilization rate for profitability is to use the following formula:
Ideal utilization rate = (Resource costs + overhead + profit margin) / (Total hours available x optimal billing rate)
To calculate your ideal utilization rate, add your resource costs, overhead, and profit margin, then divide the total by the product of total hours available and your optimal billing rate.
Using the numbers from the example above, the top number in this formula would be $75,000. You would then calculate 1,000 x 94 to equal 94,000 on the bottom of the formula and then perform the final division of $75,000 over 94,000 to get your ideal utilization rate of roughly 0.80, or 80%. This shows that your capacity utilization rate and your ideal utilization rate do, in fact, match!
Ideal utilization rate = [($50,000 + $10,000 + $15,000)] / (1,000 x 94)
What is a good utilization rate?
For most service-based businesses, a good utilization rate is between 70% and 80%. This range allows your team enough time for important non-billable activities, such as training, meetings, and professional development, while still bringing in the revenue you need.
However, there isn't one perfect number for everyone. Your ideal utilization rate depends on your industry, business model, and the roles within your team. For example, a consulting firm with high billing rates might do well at 70%, while a creative agency may need to aim for 80%. The important thing is to calculate your own ideal utilization rate and use it as your benchmark.
Utilization rate benchmarks by industry
Utilization rate benchmarks vary significantly by industry. Here are some general ranges to use as a starting point:
Professional services (consulting, legal, accounting): 70–75%. These industries tend to have higher billing rates, so profitability goals can be met even at slightly lower utilization.
Creative and marketing agencies: 75–85%. With typically lower billing rates, agencies often need higher utilization to cover costs and maintain margins.
IT services and software development: 75–80%. A mix of billable project work and internal development time makes this range common.
Manufacturing and production: 80–90%. Higher utilization is expected because roles are more directly tied to output.
Remember, these numbers are just averages. Set your target based on your own costs, billing rates, and profit goals.
What does 80% utilization mean?
An 80% utilization rate means a team member spends 80% of their available work hours on billable, client-facing tasks. In a typical 40-hour week, this looks like:
32 hours on billable, client-facing work
8 hours on internal work like meetings, emails, training, and admin
For many businesses, 80% is a healthy target because it leaves time for important non-billable work. If your team is often above 80%, check for signs of burnout. If they're often below, review your processes to see what is taking up billable hours.
Utilization rate examples
Utilization rate is an important metric for service-based businesses because it directly impacts profitability and resource management. Here are two examples that show how companies can improve employee utilization rates and overall performance.
Example 1: ABC Law Firm
ABC Law Firm, a mid-sized legal practice with 75 attorneys, was experiencing stagnant growth despite a consistent influx of clients. Upon analyzing their billable utilization, they discovered that their average rate was a mere 55%. The firm recognized that this low rate was due to inefficient processes and a lack of visibility into resource utilization.
To address these issues, ABC Law Firm implemented the following changes:
Invested in comprehensive time tracking and project management software to accurately monitor billable hours and identify areas for improvement.
Established clear utilization rate targets for each attorney based on their experience and practice area to optimize billing efficiency.
Conducted regular reviews of non-billable time to minimize unnecessary tasks and streamline processes.
By making these changes, ABC Law Firm raised its average utilization rate to 75% in one year. This led to a 25% increase in revenue and allowed the firm to hire more support staff to improve their services.
Example 2: XYZ Marketing Agency
XYZ Marketing Agency, a growing boutique agency with a moderate number of employees, was struggling to meet client deadlines and maintain profitability. The agency's management team suspected that employee utilization rates were too high, leading to overworked employees and lower work quality. Upon tracking utilization rates, they found the average was 95%, confirming their suspicions. To rectify the situation, XYZ Marketing Agency took the following steps:
Adjusted their pricing model to better align with the amount of time and resources required for each project.
Hired additional full-time employees and freelancers to distribute the workload more evenly and achieve a lower utilization rate.
Implemented a more stringent project scoping process to ensure that client work expectations were realistic and achievable.
After lowering their average utilization rate to 80%, XYZ Marketing Agency saw better employee morale and higher work quality. Client satisfaction went up by 20%, and the agency could take on more projects without lowering their service quality.
These examples show how companies can find and fix operational inefficiencies, leading to better financial results and growth. By tracking available hours, billable hours, and aiming for the right utilization rate, businesses can improve resource management and planning.
How to track utilization rate
Tracking utilization rates helps keep a healthy balance between billable and non-billable work, supports profitability, and prevents burnout. To track these rates well, consider using workload management software. Using workload management software is one of the best ways to track utilization rates. Tools like Asana let you see who is working on what and when, which helps you keep workloads balanced and prevent burnout. This visibility makes it easier to manage workloads and ensure no one goes over their maximum hours.
Key features to look for in a workload management software include:
Time tracking: Allows employees to easily log billable and non-billable hours.
Real-time visibility: Provides insights into each team member's current tasks, deadlines, and allocated hours.
Customizable reports: Offers reports and dashboards to view utilization rates by individual, team, project, or time period.
Capacity planning: Enables you to forecast future workloads and adjust resource allocation accordingly.
Integration: Connects with your existing project management and billing tools for streamlined workflows.
Along with using software, have regular check-ins with your team to talk about their workload and make changes as needed. This helps keep utilization rates on track and supports employee satisfaction.
Manage team workloads with AsanaHow to improve utilization rates
It can be frustrating to discover your team's utilization rates are low. But oftentimes, low utilization happens because of bad processes, inconsistent communication, or an imbalance between internal and external workload. Here are four ways to improve that.
To improve utilization rates, implement the following project management processes.
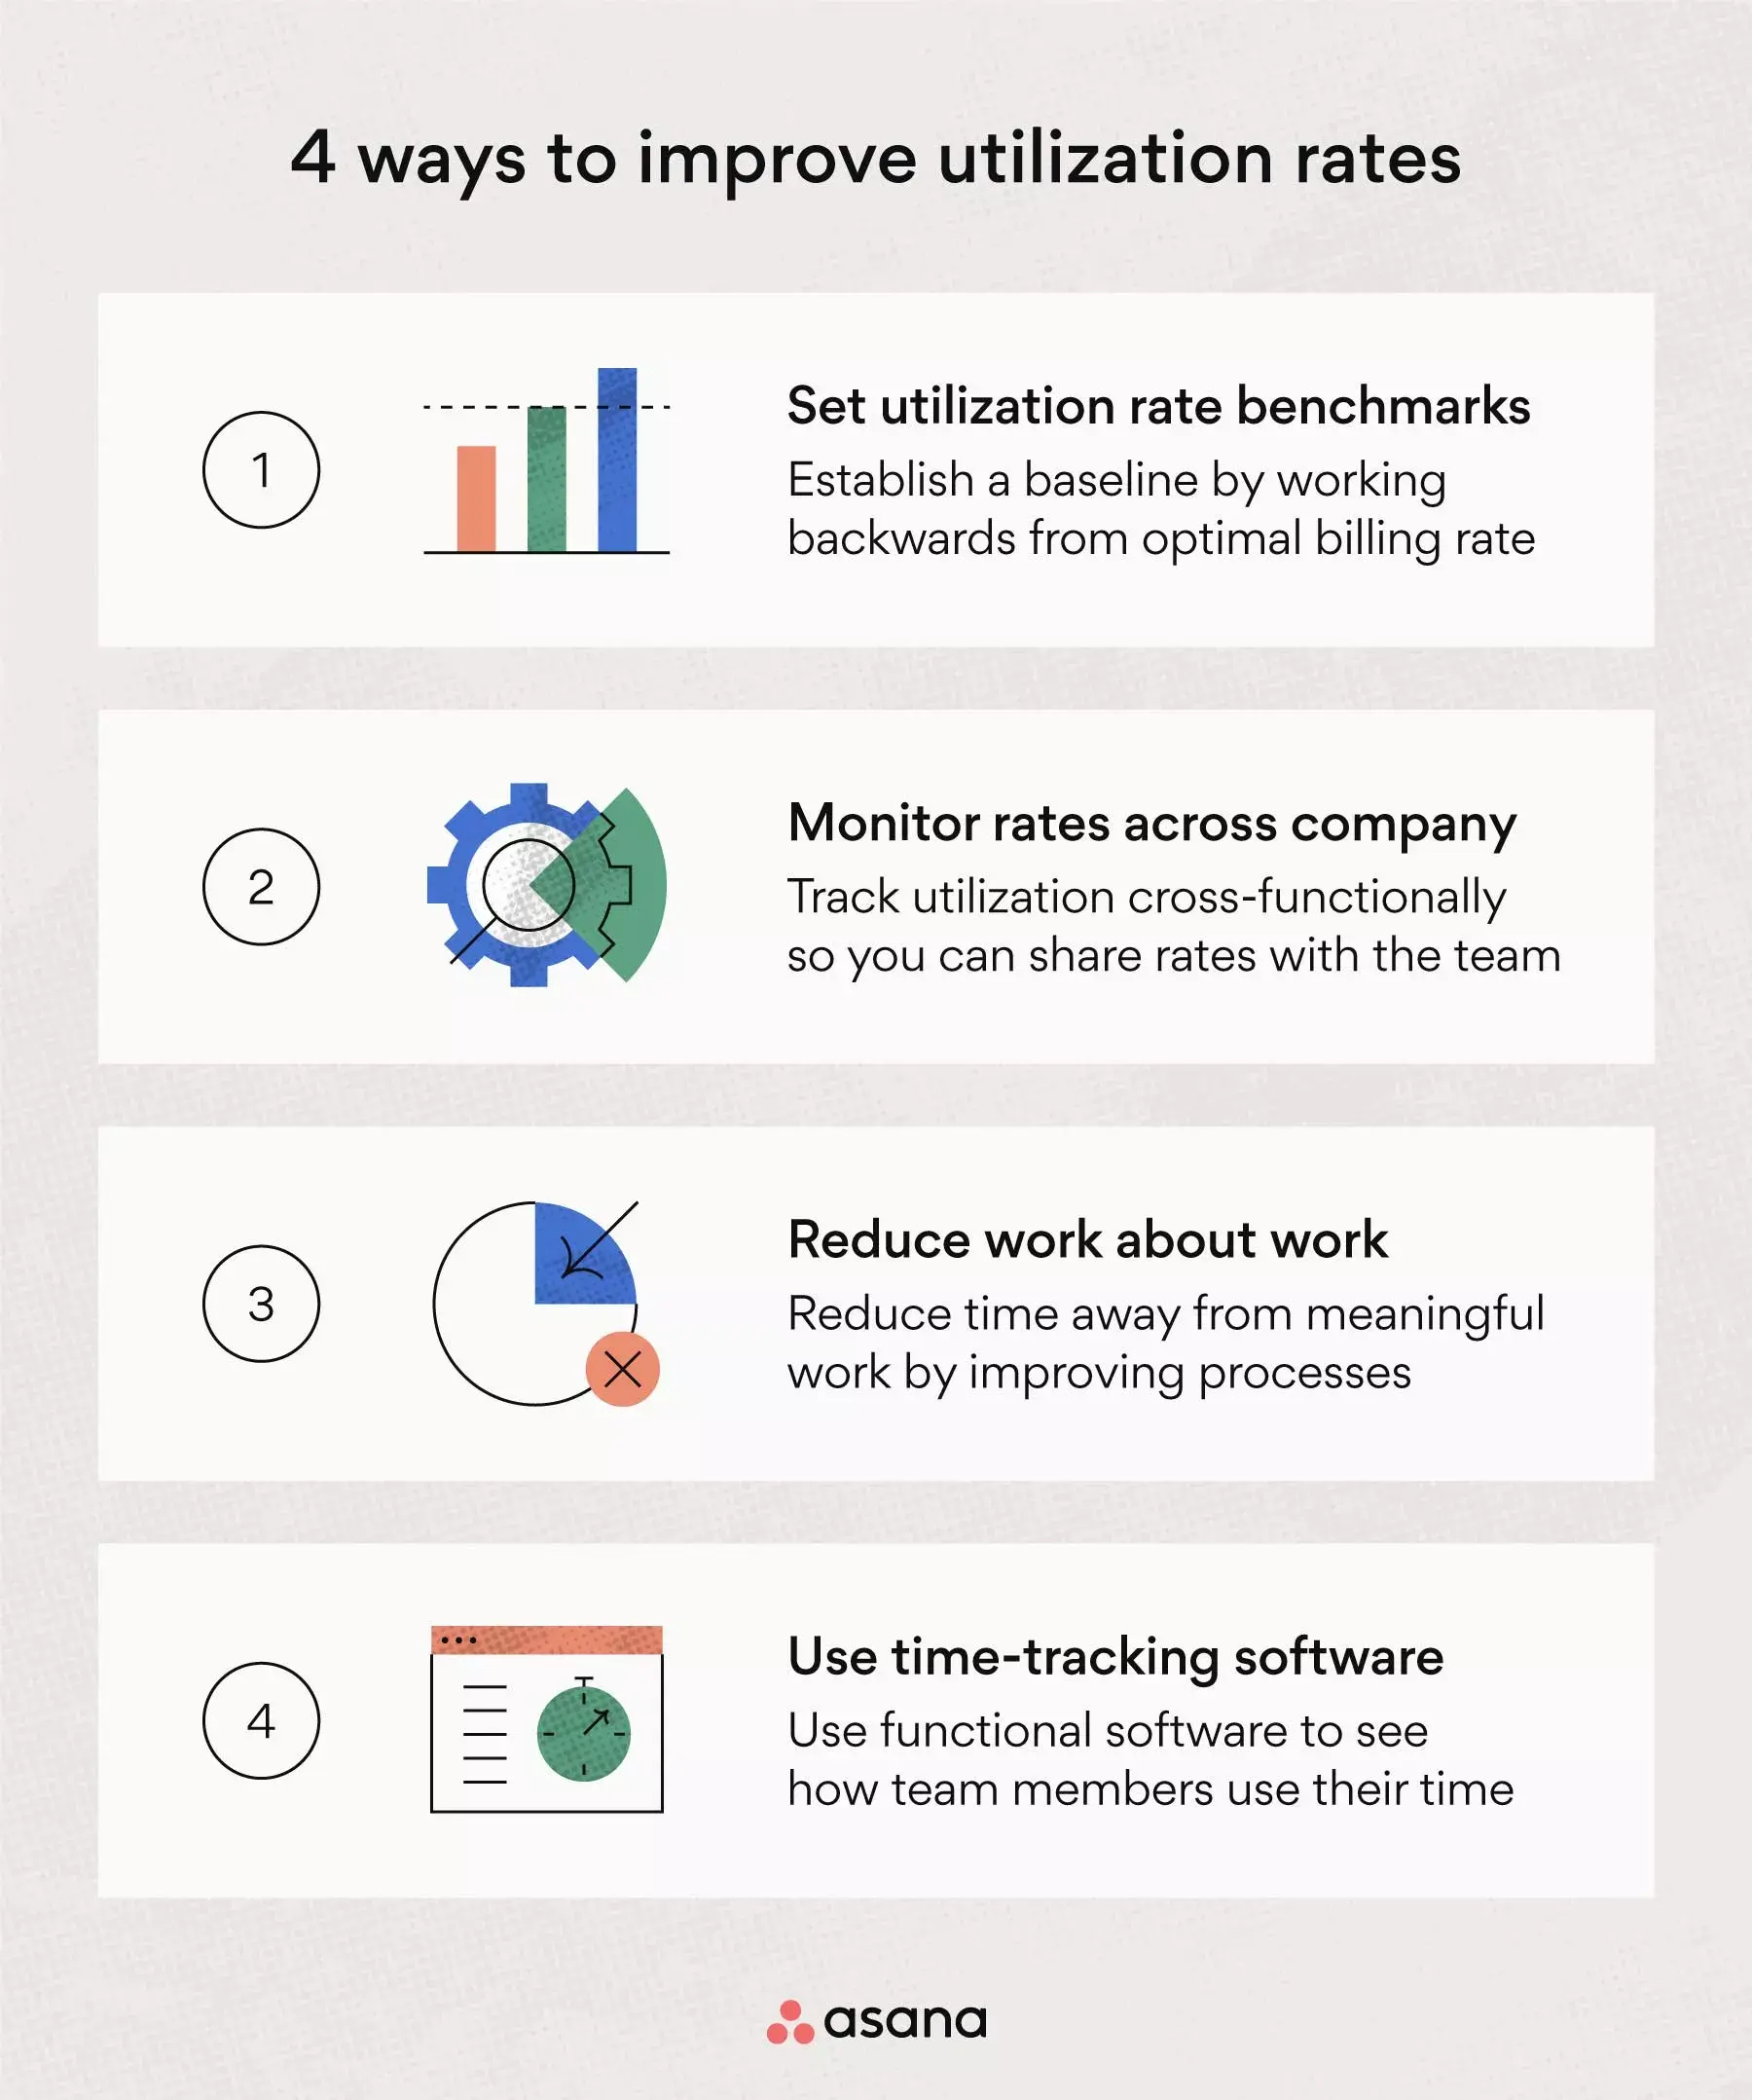
Set utilization rate benchmarks: Your team members won't know what utilization rate to reach unless you set benchmarks. You can also set unique benchmarks for team members depending on their role. For example, a designer may have a higher utilization rate benchmark than a human resource manager because designers often work directly with clients and bill more hours.
Monitor rates across the company: Tracking utilization rates across the entire company can help you determine your capacity utilization rate, so you can assess team member availability. Universal tracking will help you see when other teams have time to bill more hours, so your company can accomplish billable work without hiring freelancers.
Reduce busywork: Reducing busywork is crucial to improving utilization rates. While there will always be a number of hours dedicated to internal operations, you can employ project management best practices and offer time management tips to reduce time spent on non-meaningful work.
Use time tracking software: This software helps improve utilization rates by letting team members bill tasks to specific clients or mark them as company time. Tracking time also encourages team members to be more aware of how they use their hours and helps them meet their benchmarks.
Drive utilization rates with better work management
Utilization rate is a key metric you should track to assess team member and company performance. High utilization rates make it easier to cover operating costs and continuously increase profits, while low utilization rates may indicate problems in your processes that need to be fixed.
The best way to track overall utilization is to have team members report their tasks and follow structured processes. When tasks are reported in real time, you gain better control over resources and a clearer view of time management.
Ready to get more visibility into how your team spends their time? Get started with Asana and give your team the tools they need to stay balanced, focused, and productive.
Manage team workloads with Asana